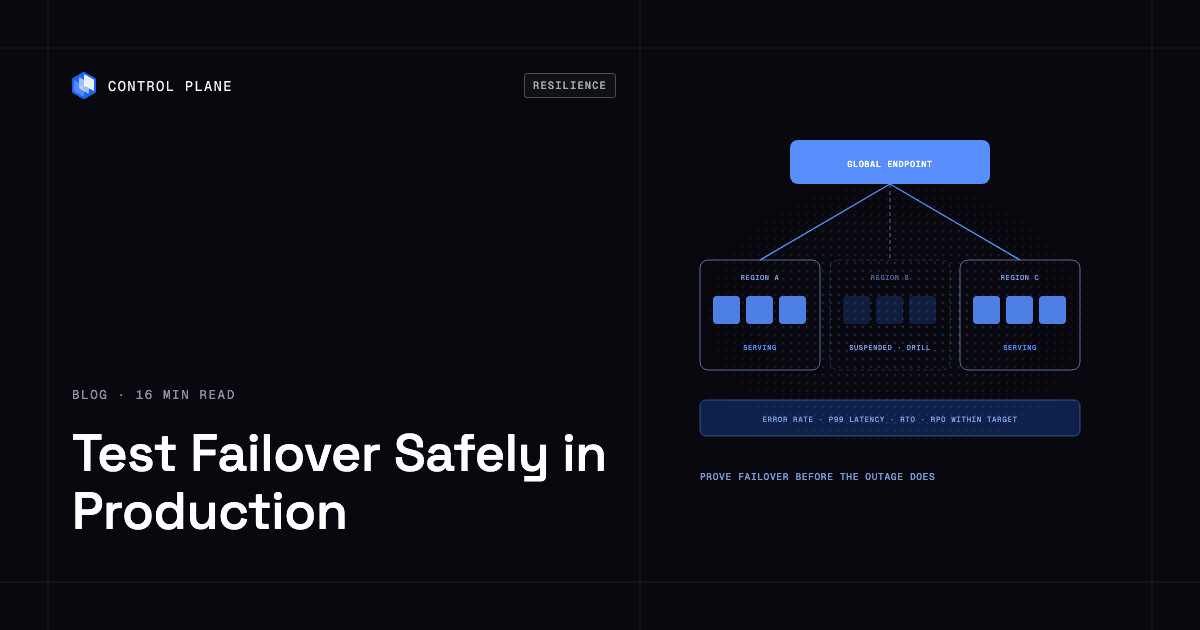
Test failover safely by climbing a ladder from tabletop exercises and staging tests to small, reversible production experiments with a limited blast radius, explicit abort conditions, and a rollback path ready. Then run scheduled region drills that prove the architecture works. The safest designs are active-active because traffic already flows through every region; on Control Plane, a workload in a Global Virtual Cloud (GVC), Control Plane’s term for a set of locations a workload runs across, runs active-active in every location and can be suspended in one location so its global endpoint sends traffic to the others, which turns a region drill into a reversible configuration change.
Disclosure: Control Plane publishes this guide.
TL;DR
Test failover by starting small, widening scope as confidence grows, and running drills on a schedule.
- The testing ladder. Progress from tabletop exercises through staging tests, small production fault injections, single-zone terminations, partial traffic shifts, and full region evacuation drills.
- Guardrails. Limit blast radius, define automatic abort conditions tied to SLOs, test the rollback path before the drill, and run during staffed hours.
- What to measure. Recovery Time Objective (RTO), Recovery Point Objective (RPO), error budget burn, p95 and p99 latency, saturation in surviving regions, time to detect, and time to decision.
- Why active-active makes testing safer. Every region already serves traffic, so there is no idle standby fleet that has to start and pass checks under pressure. A drill removes one region from rotation and confirms the others absorb the load, and the same design removes the cost of infrastructure that sits idle until a disaster. See active-active vs active-passive cost for the economics.
- How Control Plane fits. Suspend a workload in one location and its global endpoint sends requests to the remaining locations; unsuspend it to restore. One definition runs active-active across every location of the GVC.
How do I test failover without taking production down?
Use a progressive testing ladder. Each level adds realism and risk, so a team moves up only after succeeding at the level below.
| Level | What you test | Risk to production | How often |
|---|---|---|---|
| Tabletop exercise | Runbook completeness, role clarity, decision-making under pressure | None | Monthly or after architecture changes |
| Failover in staging with production-like data volumes | Automation, replication, alerting, dashboards | None if staging is isolated | Monthly |
| Dependency fault injection on a small production slice | Behavior when one dependency returns errors or latency for a percentage of traffic | Low, bounded by the traffic percentage | Monthly to quarterly |
| Single-instance or single-zone termination | Auto-healing, rescheduling, load balancer health checks | Low to moderate | Monthly |
| Partial traffic shift away from one region | Cross-region routing, capacity headroom, replication lag under load | Moderate | Quarterly |
| Full region evacuation drill | End-to-end failover including DNS, data, and dependencies | Highest of the drill types | Quarterly and after major architecture changes |
Guardrails that keep drills safe
Every test needs guardrails rooted in the principles of chaos engineering.
- Steady-state hypothesis. Before injecting a fault, define steady state as measurable output such as error rate, latency, and throughput tied to your SLOs, and hypothesize that it holds during the experiment.
- Blast radius limits. Start with a small slice of traffic or a single instance, and widen scope only after confirming stability.
- Automatic stop conditions. Set them in advance and match the abort criteria in the drill: error rate over the SLO threshold for a set window, p99 latency over the SLO latency target, saturation limits, or anyone on the drill calling abort.
- Rollback path tested beforehand. Run the rollback procedure in staging before relying on it in production.
- Staffed hours only. Run drills when the team is available to respond.
- Announce the drill. Tell internal teams and support, keep status page and customer message drafts ready in case the drill causes visible impact, and name a communications lead.
- No drills during an active incident or a change freeze.
A region-failure drill, step by step
A full region evacuation is the broadest failover test you can run.
- Define the hypothesis and targets. State what you expect, for example: “When we remove us-east-1 from rotation, all traffic shifts to us-west-2 and eu-west-1 within our target RTO, errors stay under the SLO threshold, and writes committed before the shift survive.”
- Confirm entry criteria. Before you begin, confirm that all regions are healthy and serving traffic normally; the remaining regions have capacity headroom to absorb the shifted load; recent backups are verified and replication lag is within bounds; on-call engineers are staffed and aware; dashboards, alerts, and synthetic monitors are active and confirmed working; cloud quotas, autoscaler maximums, database connection limits, and load balancer limits in surviving regions allow the scale-up. In a real regional outage, other tenants scale into the same regions at the same time, so keep headroom provisioned instead of relying on autoscaling; caches and connection pools in surviving regions are sized for the extra load.
- Pick the method. Remove the region from DNS or load balancer rotation, drain it at the platform level, or block its dependencies, depending on your architecture and the layer you want to test.
- Start with a partial shift, then evacuate fully. Shift a small share of traffic away from the target region first, watch metrics for a few minutes, then widen in steps until the region carries no traffic.
- Watch the key signals. Error rate, p95 and p99 latency, CPU and memory saturation in surviving regions, queue depth, replication lag, and connection pool use. Confirm the expected alerts fired and the page reached on-call; route drill pages to a drill channel instead of suppressing them. Check what happens to sticky sessions, WebSockets, long-lived connections, and in-flight requests, and confirm client retries are idempotent so the shift does not create duplicate writes.
- Hold for a defined period. Stay at full evacuation for 15 to 30 minutes to surface capacity and state issues that appear only under sustained load; longer holds that cover a traffic peak or scheduled jobs give stronger evidence.
- Fail back deliberately. Ramp traffic back in steps to avoid a thundering herd and cold caches in the restored region. If a replica was promoted, rebuild or rewind the old primary before it rejoins (for example with pg_rewind), confirm no writes landed on two primaries, reconcile any that did, and confirm replication lag is back to baseline before closing the drill.
- Write up results. Record measured recovery time and data loss against RTO and RPO, whether the page was delivered, failback time, and any writes that needed reconciliation; document gaps, assign owners for fixes, and schedule a follow-up test.
Abort criteria
Stop the drill immediately if any of these occur:
- The error rate stays above the SLO threshold for more than 30 seconds.
- p99 latency stays above the SLO latency target for more than 30 seconds.
- Surviving regions pass a saturation limit you set in advance, such as 85 percent CPU or memory.
- Replication lag grows beyond your RPO target.
- A real, unrelated incident begins.
- Any team member calls abort for any reason.
- Write verification fails or data integrity checks disagree between regions.
- The rollback or failback step does not behave as rehearsed.
Failure-injection tools by layer
Different tools target different layers of the stack. Match the tool to the fault you want to simulate.
| Layer | What to inject | Example tools |
|---|---|---|
| Compute and Kubernetes | Pod kills, node terminations, CPU and memory stress | Chaos Mesh, LitmusChaos |
| Cloud infrastructure | Instance termination, zone faults, API errors | AWS Fault Injection Service, Azure Chaos Studio |
| Network | Latency, packet loss, network partitions | Toxiproxy, tc netem |
| DNS and traffic | Weighted routing changes, health-check failures | Your DNS provider or global load balancer |
| Data | Replica promotion, backup restore, replication pause | Database-native tools, backup and restore scripts |
| Dependencies | Third-party API errors, slow responses | Feature flags, service proxies, or mock servers |
Chaos Mesh and LitmusChaos run inside Kubernetes and can scope experiments to specific namespaces, labels, or a share of pods. AWS Fault Injection Service supports stop conditions tied to CloudWatch alarms, tc netem shapes traffic, including packet loss, at the host network interface with no application change. Toxiproxy is a TCP proxy that injects latency, timeouts, and connection resets, so the application must connect through it.
What should I measure?
Focus on the metrics that show whether the system met its recovery objectives.
- RTO (Recovery Time Objective). The maximum acceptable time to restore service. In a drill, measure actual recovery time from fault injection until all traffic is served within SLO from the remaining regions, and compare it with the RTO.
- RPO (Recovery Point Objective). The maximum acceptable data loss, measured in time. Measure actual data loss with real writes: submit known writes immediately before and during the fault, then check which ones survived in the failover target. Without real writes, an RPO number is a guess. A routing-only drill leaves the primary running, so replication catches up and measured data loss reads as zero; to measure real RPO, stop the primary abruptly while writes are in flight.
- Error budget burn. How much of the monthly error budget the drill consumed. If one drill burns a large share, failover is too slow or too noisy.
- p95 and p99 latency. Spikes reveal routing delays, cold starts, or connection pool exhaustion.
- Saturation in surviving regions. CPU, memory, connection pools, and queue depth. Regions near saturation lack the headroom to survive a real outage.
- Time to detect. How long monitoring took to alert after the fault. Slow detection makes a real incident’s RTO much longer than the drill suggests.
- Time to decision. How long the team took to act after detection, which measures human readiness.
DNS TTLs and client caching often dominate failover time. With a 300-second TTL, clients can keep sending traffic to the failed region for up to five minutes no matter how fast the platform reacts, and longer when resolvers, JVM caches, or long-lived connections ignore or extend the TTL. Measure client-observed failover time as well as the server-side routing change, with synthetic probes from several geographies against the public endpoint.
How do I survive a full cloud provider outage without a disaster recovery runbook?
You cannot rely on a plan nobody has executed; an untested runbook fails under pressure. Architecture shortens the runbook when failover is the normal path, with active-active deployment across regions or providers, health-checked global routing, and data replicated ahead of time, plus regular drills that prove it works. Data promotion, failback, and customer communication still need written, rehearsed steps.
Drills keep finding the same gaps:
- Identity and authentication. An identity provider in one region locks users out everywhere when that region fails.
- Secrets management. Secrets in a single-region vault become unavailable during a regional outage.
- CI/CD pipelines. A single-region pipeline cannot deploy fixes during the outage.
- DNS management. A DNS control plane in the affected region cannot update routing.
- Observability. A logging and monitoring stack in the failed region goes dark exactly when you need it.
- Capacity shortfalls. Surviving regions may lack the compute, memory, or database connections to carry the full load.
- Stale DNS TTLs. Long TTLs delay traffic shifts even when routing changes are instant.
- Replication lag. With asynchronous replication, the most recent writes may not have reached the surviving region.
- Container registry. Images stored in one region cannot be pulled when you scale up elsewhere.
- Encryption keys and certificates. Keys and certificate issuance tied to one region can block decryption and TLS.
- Third-party SaaS and status pages. Vendors, and your own status page, may run in the failed region.
For the architecture side, see how to keep your app online when an AWS region goes down.
How can my company avoid being taken down by the next major cloud outage?
Treat outages as expected events and design for them:
- Map critical paths. List every service, dependency, and data store in the critical path, and flag anything that exists in only one region.
- Remove single-region dependencies. Replicate identity, secrets, DNS, observability, and CI/CD across regions or providers.
- Run active-active for critical services. Serve traffic from several regions at once so failover is a routing adjustment instead of a cold start.
- Keep capacity headroom. With two regions, each must handle 100 percent of traffic; with three, each should handle at least 50 percent, and quotas in each region must allow that scale.
- Drill quarterly. Run the region-failure drill at least once a quarter and treat drill failures as high-priority bugs.
- Learn from real incidents. Study public cloud outages for patterns that apply to your architecture; the cloud outage tracker is a useful reference.
How do I stop paying for idle disaster recovery infrastructure?
Traditional active-passive disaster recovery keeps a warm or cold standby environment that mirrors production. The standby fleet costs compute, storage, and licensing while serving no traffic, and because it sits idle it tends to drift from production in configuration and capacity, so it may not work when needed.
Active-active architecture removes the idle standby by serving traffic from every region at all times. Every region is production, and drills test capacity that is already in use.
The trade-offs are real. Active-active needs data replication and a consistency model your application can tolerate, cross-region traffic costs rise, and each region needs headroom to absorb traffic from a failed peer. Those costs replace the standby fleet’s compute, storage, and licensing. For a detailed comparison, see active-active vs active-passive cost.
How Control Plane fits
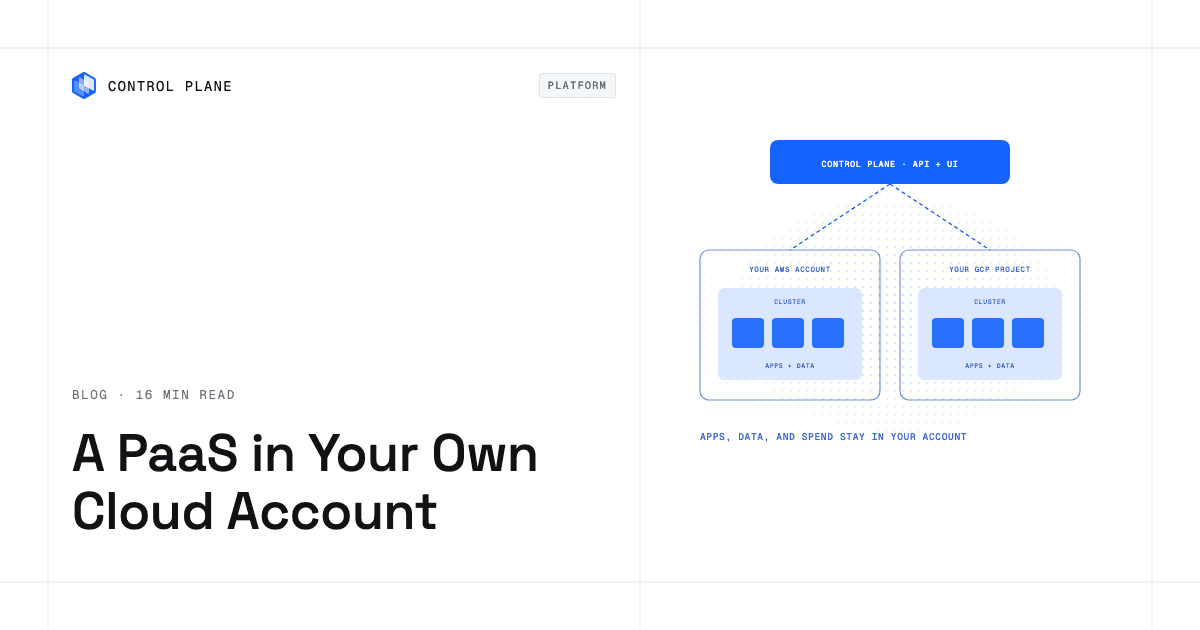
Control Plane is the unbreakable platform for running production workloads. It runs serverless, standard, stateful, and cron workloads natively on AWS, GCP, and Azure, VM workloads on locations joined through Control Plane’s Managed Kubernetes, and workloads on Kubernetes clusters you already run or your own machines, including on premises, active-active across regions and clouds.
A workload deployed to a GVC runs active-active in every location of that GVC from one definition, and a global endpoint routes each request to the nearest healthy location. Locations can be on AWS, GCP, Azure, Kubernetes clusters you already run, or your own machines, so one GVC can span providers. For the architecture in depth, see how to build active-active high availability across regions and clouds.
Region drills as a configuration change
A workload can be suspended in a single location through its location-specific options. With no ready replicas there, requests to its global endpoint fail over to the remaining locations, and unsuspending restores the location. If clients reach the workload through the GVC alias endpoint instead of the workload’s canonical endpoint, set the GVC’s alias workload link to that workload before the drill; otherwise the alias uses a TCP-only health check and keeps sending traffic to the suspended location. For calls between workloads in the same GVC, set the called workload’s internal routing to gvcEndpoint so those calls fail over too; it is the default for new workloads, but workloads created before the setting existed keep calls in their own location. For TCP-only workloads, location health is checked at the TCP level and a location with no ready replicas can still be selected unless it is suspended, so use suspend for drills. Each location also has its own endpoint, so you can test a location directly. Removing a location from a GVC drains every workload in that GVC from it and shifts traffic to the locations that remain, which makes it a migration step; use per-workload suspend for drills. Suspend simulates a clean, total loss of one location, so pair it with latency and partial-failure injection, because real outages are often partial or slow.
Control Plane’s location routing options, set per GVC, give each location a priority tier, a latency offset that makes it look nearer or farther to geo-routing, and a latency tolerance. Raising a location’s latency offset makes it look farther away, so users near the boundary move to other locations first, and moving it to a lower-priority tier takes it out of rotation while higher-priority locations are healthy. Neither sets a percentage weight, so a percentage ramp needs a weighted DNS or load balancer layer in front.
Rollouts and observability
Rollouts keep the last healthy version serving in each location until the new version reports ready through its health probes. Built-in logs, metrics, and traces show error rate and latency per location throughout the drill, and Control Plane’s tamper-proof audit trail records each platform action, such as suspending and unsuspending a workload in a location. Steps taken outside Control Plane, such as DNS changes or fault-injection tools, need their own records.
Data layer
Control Plane’s Template Catalog includes Postgres Multi-Location, a Patroni cluster with a single primary and automatic promotion of a replica in a surviving location. Automatic failover needs three or more locations; with two, the survivor stays read-only until you promote it manually. Replication is asynchronous, so the most recent writes can be lost, and the template has no per-location suspend, so suspending application workloads in a location does not fail the database over; drill promotion separately. The pgEdge template runs multi-master PostgreSQL in which every location accepts writes, with asynchronous replication and last-update-wins conflict resolution, so concurrent writes to the same row in two locations keep only the later one. Other databases keep their own replication model, so drill them separately too.
Proven in a real outage
During the October 20, 2025 AWS us-east-1 outage, which lasted about 15 hours, Control Plane customers with us-east-1 in their GVC had no downtime, and their workloads were “active and running in healthy locations within 10 seconds,” according to Control Plane internal incident telemetry.
SLA, operations, and cost
The 99.999% availability SLA applies to workloads running at least two replicas in at least two locations, and those locations can be on different providers. Control Plane handles Day 2 operations for you, including autoscaling, right-sizing with Control Plane’s Capacity AI, which adjusts reserved CPU and memory based on historical usage, built-in observability, and security, with no Kubernetes cluster you have to operate. Customers typically cut compute costs 30 to 50 percent compared with running directly on AWS, GCP, or Azure. Control Plane is PCI DSS Level 1, SOC 2 Type II, HIPAA, and GDPR compliant.
FAQ
Common questions from teams planning their first failover drills and chaos experiments.
What is a game day?
A game day is a scheduled, time-boxed exercise where a team simulates failures to practice technical response, incident communication, and runbook execution. It tests human coordination as well as system behavior, and it usually assigns roles such as incident lead, fault-injection operator, responders, observers, communications lead, and scribe.
How often should we run failover drills?
Run full region evacuation drills at least quarterly and after major architecture changes. Single-instance and single-zone terminations can run monthly, dependency fault injections monthly to quarterly, and tabletop exercises monthly or after any significant change.
Is chaos engineering safe in production?
Yes, when each experiment has a small blast radius, stop conditions tied to SLOs, a rehearsed rollback, and staff on hand. Production is the only place real traffic patterns, capacity limits, and dependencies show up.
What is the difference between RTO and RPO?
RTO is the maximum acceptable time to restore service after a failure. RPO is the maximum acceptable data loss, measured in time; an RPO of five minutes means you can tolerate losing the last five minutes of writes. Measure both during drills with real writes and client-side timing.
How do I test RPO during a drill?
Write known records just before and during the fault, then check which ones exist in the target region after failover. The gap between the last surviving write and the moment of failure is your measured data loss. Kill the primary abruptly, because a graceful drain hides replication lag.
What is the biggest risk of not testing failover?
Discovering during a real outage that failover does not work. Common causes are capacity shortfalls in the surviving region, hidden single-region dependencies such as identity or secrets, long DNS TTLs, and replication lag.
How do I test failover for stateful workloads?
Test database failover separately from application failover. Promote a replica, verify data consistency, measure replication lag, and confirm the application reconnects to the new primary; with asynchronous replication, confirm the application handles the loss of the most recent writes. Test failback too: rebuild the old primary as a replica and check that no writes reached two primaries during the split.
Can I run a region-failure drill without an active-active architecture?
Yes, but it is riskier and slower. With active-passive, the standby region must start, warm up, and pass checks before it serves traffic, and drift from production makes that more likely to fail. Active-active drills are safer because every region already serves traffic.
How does Control Plane make region drills easier?
Each workload can be suspended in one location while the global endpoint serves from the others, and each location has its own endpoint for direct checks. The audit trail logs each platform action, and database failover still needs its own drill.
What should I do after a failed drill?
Treat it as a high-priority finding. Document what failed, find the root cause, assign an owner, and rerun the drill once the fix ships; a gap found in a drill costs far less than one found in an outage.
Ready to run workloads active-active and make region drills a configuration change? Talk to the Control Plane team or sign up free.