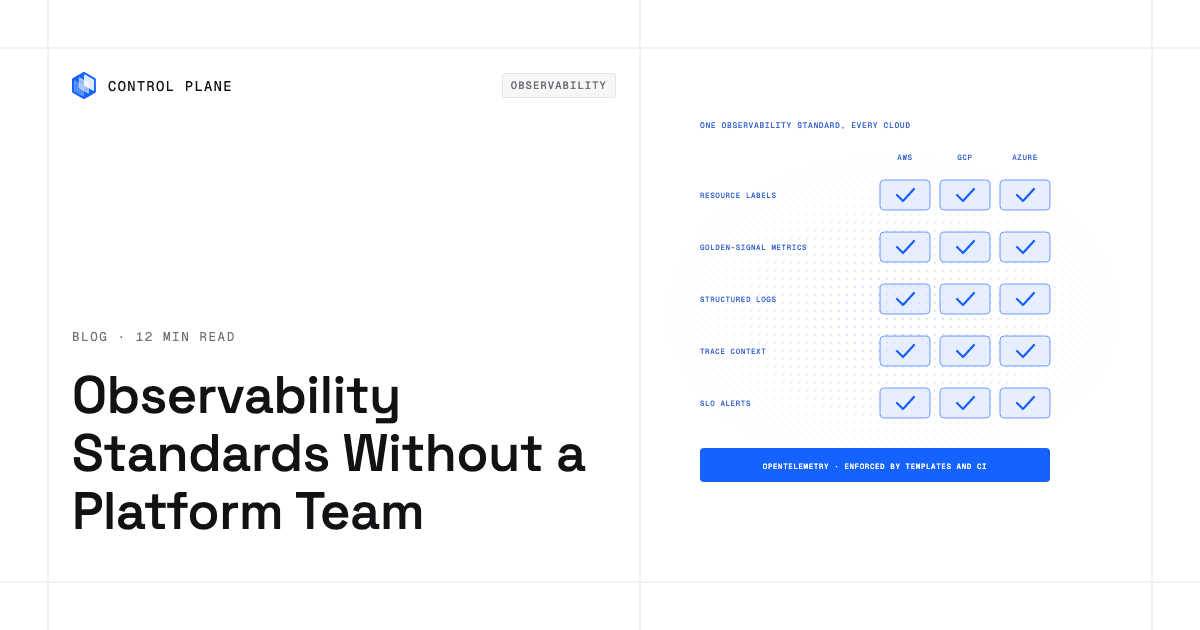
Without a platform team, implement observability standards by adopting OpenTelemetry as the single instrumentation standard, defining a short mandatory set of resource attributes, golden-signal metrics, structured log fields, trace propagation, and SLO alerts, and enforcing them through templates, CI checks, and a platform that collects telemetry by default. The less each team has to wire up per cloud, the more consistently the standard holds.
Amazon CloudWatch, Azure Monitor, and Google Cloud Observability each use different metric names, log formats, and trace schemas, so multi-cloud telemetry fragments unless someone sets a standard. This guide covers an eight-step plan, a minimum standard per signal, four enforcement approaches, and a rollout order for small teams.
Disclosure: Control Plane publishes this guide.
TL;DR
- Instrumentation. Use OpenTelemetry SDKs and the OpenTelemetry Collector as the single instrumentation layer across all clouds.
- Attributes. Require every service to emit a fixed set of resource attributes named per OpenTelemetry semantic conventions: service.name, service.version, deployment.environment.name, cloud.provider, cloud.region, and a custom team attribute.
- Metrics. Collect the golden signals for every service: request duration as a histogram (from which request rate and error rate are derived) and saturation.
- Logs. Emit structured JSON logs with timestamp, level, trace_id, span_id, and service name.
- Traces. Propagate W3C Trace Context headers across all service boundaries.
- Retention. Write the retention policy into the standard, for example 30 days for logs, 7 to 15 days for traces, and 13 months for downsampled metrics.
- Alerts. Page on SLO burn rate and link every alert to a runbook.
- Enforcement. Use service templates, CI pipeline checks, and automated audits instead of per-deploy approvals, plus a short monthly coverage review.
- Where Control Plane fits. Control Plane collects logs and default metrics (request rate, latency histograms, CPU, memory) for every workload automatically, tags them with the same platform labels in every cloud and region, turns on OpenTelemetry tracing with one setting on the org or on a Control Plane Global Virtual Cloud (GVC), and ships logs to up to four external providers. That puts the collection, labeling, and export layer of this standard in place from the first deploy.
How do you implement observability standards across services without a platform team in multi-cloud infrastructure?
A small team can define and roll out this standard in about four weeks. Steps 1 to 6 define the standard and steps 7 and 8 enforce it.
Step 1. Pick OpenTelemetry as the single instrumentation standard. OpenTelemetry is vendor-neutral, accepted by most observability backends over OTLP, and defines metrics, logs, and traces in one specification, though log SDK maturity still varies by language. Standardizing on it removes per-cloud instrumentation differences. The project provides SDKs for major languages and a Collector that handles export, batching, and retry.
Step 2. Define the attribute schema. Keep the list short and use OpenTelemetry semantic convention names: service.name, service.version, deployment.environment.name, cloud.provider, and cloud.region, plus a custom team attribute, since the conventions define no ownership attribute. Add cloud.availability_zone if you need zone-level breakdowns. Write the schema down in a versioned document in your shared repository. These attributes are what make cross-service and cross-cloud queries possible.
Step 3. Set golden signals and SLOs. Every user-facing service should expose request duration as a histogram, from which request rate and error rate are derived, plus at least one saturation metric such as CPU or memory utilization. Define an availability SLO and a latency SLO for each user-facing service, and use error budgets to decide when to page.
Step 4. Standardize the log format. Require structured JSON logs with timestamp, log level, trace_id, span_id, service name, and message. This makes logs queryable and joinable with traces in any backend.
Step 5. Propagate trace context. Adopt W3C Trace Context as the propagation format. Every HTTP client, gRPC client, and message producer must inject the traceparent and tracestate headers, and every server and consumer must extract them. OpenTelemetry instrumentation libraries handle HTTP and gRPC; message queues often need manual injection into message headers.
Step 6. Pick one backend or a vendor-neutral export path. Teams can keep different observability vendors as long as telemetry leaves services through one export path. Run OpenTelemetry Collectors that normalize telemetry and fan out to the backends your organization uses, so the instrumentation standard stays uniform even if teams prefer different dashboards.
Step 7. Enforce with templates and CI. Create a service template (a starter repository or Helm chart) that includes the OpenTelemetry SDK, the required attributes, structured logging configuration, and a golden-signals dashboard definition. Add a CI check that fails the build if the deploy manifest or OpenTelemetry configuration is missing required attributes, and a unit test that asserts the logger emits the required fields. Treat policy as code for observability the same way you treat it for infrastructure.
Step 8. Review monthly. Hold a short monthly review where service owners compare their telemetry coverage against the standard. Check for attribute drift, missing trace propagation, and SLO accuracy, and update the standard document when you learn something new.
The plan needs one person to own the standard document, a shared template repository, and a CI check. Building production-grade infrastructure without a platform team covers the broader operational pattern.
The minimum observability standard for every service
Numeric values in the table are starting suggestions; adjust them to your scale and budget.
| Signal | Required standard | Why it matters | How to enforce it |
|---|---|---|---|
| Resource attributes | service.name, service.version, deployment.environment.name, cloud.provider, cloud.region, and a custom team attribute on every metric, log, and trace | Enables filtering, grouping, and ownership routing across clouds | Service template sets attributes through OTEL_RESOURCE_ATTRIBUTES; a deploy-time check rejects manifests missing any of them |
| Request metrics | Request duration as a histogram (OpenTelemetry http.server.request.duration, exported to Prometheus as http_server_request_duration_seconds), with request rate and error rate derived from its count by status code | The foundation of golden-signal monitoring and SLO calculation | OpenTelemetry instrumentation emits this histogram for most HTTP frameworks, though some libraries, such as Python’s, still need OTEL_SEMCONV_STABILITY_OPT_IN=http to switch from the older http.server.duration metric; gRPC instrumentation emits the equivalent RPC server duration histogram |
| Saturation metrics | CPU utilization, memory utilization, and queue depth where applicable | Detects resource exhaustion before it causes user-visible errors | Runtime metrics from the OpenTelemetry SDK; platform metrics from the infrastructure layer |
| Structured logs | JSON with timestamp, level, trace_id, span_id, service, and message | Joins logs to traces and supports structured queries | Logging wrapper in the service template; a unit test asserts required fields in log output |
| Trace propagation | W3C Trace Context (traceparent header) on all outbound HTTP, gRPC, and message queue calls | Enables end-to-end tracing across service and cloud boundaries | Instrumentation libraries in the template; an integration test checks header presence |
| Trace sampling | A stated sampling policy, such as 10% of traces plus every trace that contains an error | Controls trace storage cost while keeping failures visible | Tail sampling processor in a shared Collector tier, with a load-balancing exporter so all spans of a trace reach the same instance |
| Retention | A written policy, for example 30 days for logs, 7 to 15 days for traces, and 13 months for downsampled metrics | Prevents unbounded storage cost and sets the debugging window | Retention configured in the backend and documented in the standard |
| SLOs | Availability and latency SLOs for every user-facing service, for example 99.9% availability and 99% of requests under 500 ms over a rolling 30 days | One measure of service health that aligns engineering and business priorities | SLO definitions stored as code; burn-rate alerts generated from them |
| Alerts | Page on SLO burn rate; raw CPU or memory thresholds create tickets at most | Reduces alert fatigue and focuses on user impact | Alert rules generated from SLO definitions; CI validates each alert’s runbook link |
| Dashboards | One golden-signals dashboard per service showing rate, errors, duration, and saturation | Gives every on-call engineer the same starting point during incidents | Dashboard definition generated from the service template |
| Runbook link | Every alert links to a runbook | Shortens resolution for on-call engineers unfamiliar with a service | CI check validates that every alert rule includes a runbook_url annotation |
Which approaches enforce observability standards without a platform team?
The right approach depends on how much consistency you need across clouds and how much per-service configuration you can accept.
| Approach | What it collects by default | What each team still configures | Multi-cloud consistency | Typical fit |
|---|---|---|---|---|
| A platform with built-in observability (Control Plane) | Logs and default metrics (requests, latency histograms, CPU, memory, replicas) for every workload, tagged with the same platform labels in every location; built-in Grafana dashboards and alert rules; OpenTelemetry tracing enabled per org or GVC | Application attributes (team, version, environment), tracing provider and sampling, custom metrics, SLO definitions, and alert contact points | High; a workload deployed to a GVC, Control Plane’s named set of locations across one or more clouds, runs from the same definition in every location | Teams that want logs, metrics, dashboards, and alert rules in place from the first deploy without operating a telemetry stack, on one cloud or several |
| Self-managed open source (OpenTelemetry Collector, Prometheus, Grafana, Loki, Tempo or Jaeger) | Nothing until each component is deployed and configured | Collector pipelines, scrape configs, dashboards, alerts, retention, and storage | High with shared Collector configs; low if each team deploys independently | Teams with strong infrastructure skills and time to operate the stack |
| Commercial observability SaaS (for example Datadog, New Relic, Grafana Cloud) | Host metrics, container metrics, and logs after agent installation; vendor agents can auto-instrument traces | Custom instrumentation, custom metrics, attribute schemas, SLO definitions, and alert rules | Medium; agents work across clouds, but attribute schemas and dashboards still vary unless standardized | Teams that want managed storage and querying and can standardize instrumentation themselves |
| Each hyperscaler’s native tools (CloudWatch and X-Ray, Azure Monitor and Application Insights, Google Cloud Observability) | Metrics and logs for that cloud’s managed services | Unified dashboards, consistent attributes, cross-cloud trace stitching, and SLOs | Low; each tool is built around its own cloud, and its cross-cloud options (such as CloudWatch data-source connectors or Azure Arc) need setup per source and do not produce a shared attribute schema or cross-cloud traces | Teams running primarily on one cloud |
Self-managed open source offers the most flexibility and the most operational work. Hyperscaler-native tools are the easiest to start and the hardest to unify. A platform with built-in observability, such as Control Plane, moves the most collection into defaults, which matters when nobody maintains shared telemetry infrastructure.
What should a small team standardize first?
Roll out the standard in this order, based on impact and dependency.
- Attributes and log format. These are prerequisites for everything else. Without consistent attributes you cannot filter dashboards, route alerts, or attribute costs, and without structured logs you cannot join logs to traces.
- Golden-signal metrics. The request duration histogram, with rate and errors derived from it, is the minimum viable monitoring for any service. OpenTelemetry instrumentation provides most of it with little code.
- Trace propagation. W3C Trace Context is the default propagator in OpenTelemetry SDKs, so HTTP and gRPC calls usually propagate once instrumentation libraries are installed. Message queues and custom transports often need manual header injection.
- SLO alerts. Define availability and latency SLOs for user-facing services and set up burn-rate alerts to replace noisy threshold alerts.
- Dashboards. Generate a golden-signals dashboard per service from the service template.
- Telemetry cost controls. Once data flows, review trace sampling, log verbosity, metric cardinality, and retention to prevent cost surprises as you scale.
Teams that want developer self-service with guardrails can build this order into their service creation workflow so every new service starts with the right defaults.
Common mistakes
- Per-cloud dashboards that never match. Separate dashboards for AWS, GCP, and Azure give three different views of the same service. Normalize attributes and use one dashboard definition per service.
- Unbounded label cardinality. Dynamic values such as user IDs or request IDs as metric labels inflate storage cost and slow queries. Keep metric labels to the fixed set in the standard and put high-cardinality data in trace attributes.
- Sampling 100% of traces forever. Full sampling helps during rollout but does not scale. Set a baseline rate and keep error traces with tail sampling in the Collector.
- No owner attribute. Without a
teamattribute, alerts cannot be routed and dashboards cannot be filtered by ownership. - Logs without trace IDs. Logs that lack a
trace_idfield cannot be joined to the trace for the same request.
How Control Plane fits
Control Plane is the unbreakable platform for running production workloads. It runs serverless, standard, stateful, and cron workloads natively on AWS, GCP, Azure, and Oracle Cloud Infrastructure (OCI), VM workloads on locations joined through Control Plane’s Managed Kubernetes, and workloads on Kubernetes clusters you already run or your own machines, including on premises, active-active across regions and clouds.
Control Plane handles Day 2 operations for you, including autoscaling, built-in observability, and security. The 99.999% availability SLA applies to workloads running at least two replicas in at least two locations. For teams without a platform team, the collection layer of this standard is in place by default: logs and default request, latency, CPU, and memory metrics for every workload, plus built-in Grafana dashboards and alert rules. Teams keep ownership of application attributes, log fields, trace propagation, and SLOs, and the platform removes the per-cloud setup underneath them.
Logs. Logs from every workload, including container output and sidecar access logs for incoming requests and outgoing calls, are collected automatically and queried with LogQL, using labels such as gvc, workload, location, provider, replica, container, and stream. Logs, metrics, and traces are retained for 30 days by default, and each retention period can be adjusted independently on the org.
Metrics. Every workload reports request rate, a request-latency histogram, CPU, memory, replica count, and restarts by default, queryable with PromQL in a Prometheus-compatible metrics store. Built-in Grafana dashboards, reached from the console, include provisioned alert rules for repeated container restarts and stuck deployments, and you can add your own rules there, such as latency SLO burn-rate alerts on the request-latency histogram. Alerts notify any contact point you add. Workloads can expose custom metrics, and the metrics store can be added as a datasource in your own Grafana.
Traces. Tracing uses OpenTelemetry and is turned on for the whole org or per GVC, with the native Control Plane tracing provider or any OpenTelemetry collector endpoint, and a sampling percentage from 0 to 100. Once tracing is on, each workload’s sidecar records a span for every request hop with no SDK in the application; services forward the W3C traceparent and tracestate headers to keep those hops in one trace (B3 headers are not read).
External log shipping. An org can ship its logs to up to four external providers at once, including Datadog, Elastic, Amazon CloudWatch, Grafana Loki, Logz.io, and any OpenTelemetry-compatible target over OTLP/HTTP. Logs stay available in Control Plane as well.
Multi-cloud consistency. A workload deployed to a GVC runs in every location of that GVC from one definition, so the same platform labels and collection apply in every cloud and region.
Audit trail. Every action in the console, CLI, Terraform, Pulumi, the Kubernetes operator, and the Control Plane MCP server is recorded in Control Plane’s tamper-proof audit trail.
Works with the vendor you already use. Teams invested in Datadog, Elastic, or another backend keep it. Control Plane ships logs to it natively, sends traces to an OpenTelemetry collector endpoint, and exposes metrics on a Prometheus-compatible federation endpoint that a collector or your own Prometheus can scrape, so the platform adds collection underneath your backend. Built-in collection covers the workloads Control Plane runs; services hosted elsewhere keep their existing instrumentation.
10 best multi-cloud management platforms in 2026 compares platforms that handle multi-cloud operations, and the CTO guide to reducing cloud tools and vendors covers consolidating the tools a team runs.
FAQ
Each answer assumes OpenTelemetry instrumentation and the attribute schema from step 2.
How do you implement observability standards across services without a platform team in multi-cloud infrastructure?
Standardize instrumentation on OpenTelemetry, define a short mandatory set of resource attributes, golden signals, log fields, trace propagation, and SLO alerts, and enforce them with service templates and CI checks. A platform that collects telemetry by default, such as Control Plane, removes most per-service collection setup.
What is an observability standard?
An observability standard is a documented set of rules for what telemetry every service must emit, in what format, with which attributes, and at what retention, across metrics, logs, traces, SLOs, alerts, and dashboards. It makes every service’s health comparable regardless of which cloud runs it or which team owns it.
Should we use OpenTelemetry?
Yes, for most teams. OpenTelemetry is a CNCF graduated project accepted by most observability vendors over OTLP, with one API and SDK model for metrics, logs, and traces, though log support is still maturing in some languages. Because it is vendor-neutral, you can switch backends without re-instrumenting code.
What labels should every service emit?
Use OpenTelemetry semantic convention names: service.name, service.version, deployment.environment.name, cloud.provider (aws, gcp, azure), cloud.region, and a custom team attribute for ownership. These six attributes support filtering, alert routing, and cost attribution across all signals.
How do you keep observability consistent across AWS, GCP, and Azure?
Use OpenTelemetry semantic conventions so metric names, log fields, and span attributes match in every cloud, require the same resource attributes everywhere, and route telemetry through one shared Collector tier or a platform that collects telemetry the same way everywhere. On Control Plane, a workload deployed to a GVC that spans several clouds gets the same collection and platform labels in every location.
How much telemetry should we keep and for how long?
A reasonable starting point is 30 days for logs, 7 to 15 days for traces, and 13 months for downsampled metrics, adjusted for compliance requirements and budget.
Do we need a platform team for observability?
No. A small team can keep observability consistent with a written standard, service templates, and CI checks. The more that shared templates or a platform like Control Plane handle by default, the less a dedicated platform team is needed.
How does Control Plane handle observability?
On Control Plane, every workload gets logs (queried with LogQL, 30-day default retention) and default metrics (request rate, latency histograms, CPU, memory) with no agent to install, viewed in built-in Grafana dashboards that include alert rules. OpenTelemetry tracing is turned on per org or per GVC, and logs can also go to up to four external providers at once.
To enforce observability standards across clouds without building a platform team, talk to the Control Plane team or sign up free.