Solutions
Unprecedented observability across your entire cloud
Aggregated logging, metrics, and tracing — eliminate blind spots in your applications, no matter where they're deployed.
Real-time visibility, everywhere
Gain real-time visibility into your application logs across all cloud environments. Troubleshoot, monitor, and resolve issues quickly. Control Plane centralizes logs, metrics, and tracing from workloads executing across one or multiple locations, presenting them as if they originated from a single source.
Centralized log management
Gain complete visibility into your application logs — enabling faster issue resolution, improved monitoring, and optimized performance across your entire cloud footprint.
Cloud-agnostic log aggregation
Seamlessly collect and centralize logs from workloads running across multiple cloud providers and locations. Access centralized logs through the Control Plane UI and CLI, with a user-friendly interface for executing queries and inspecting log data.
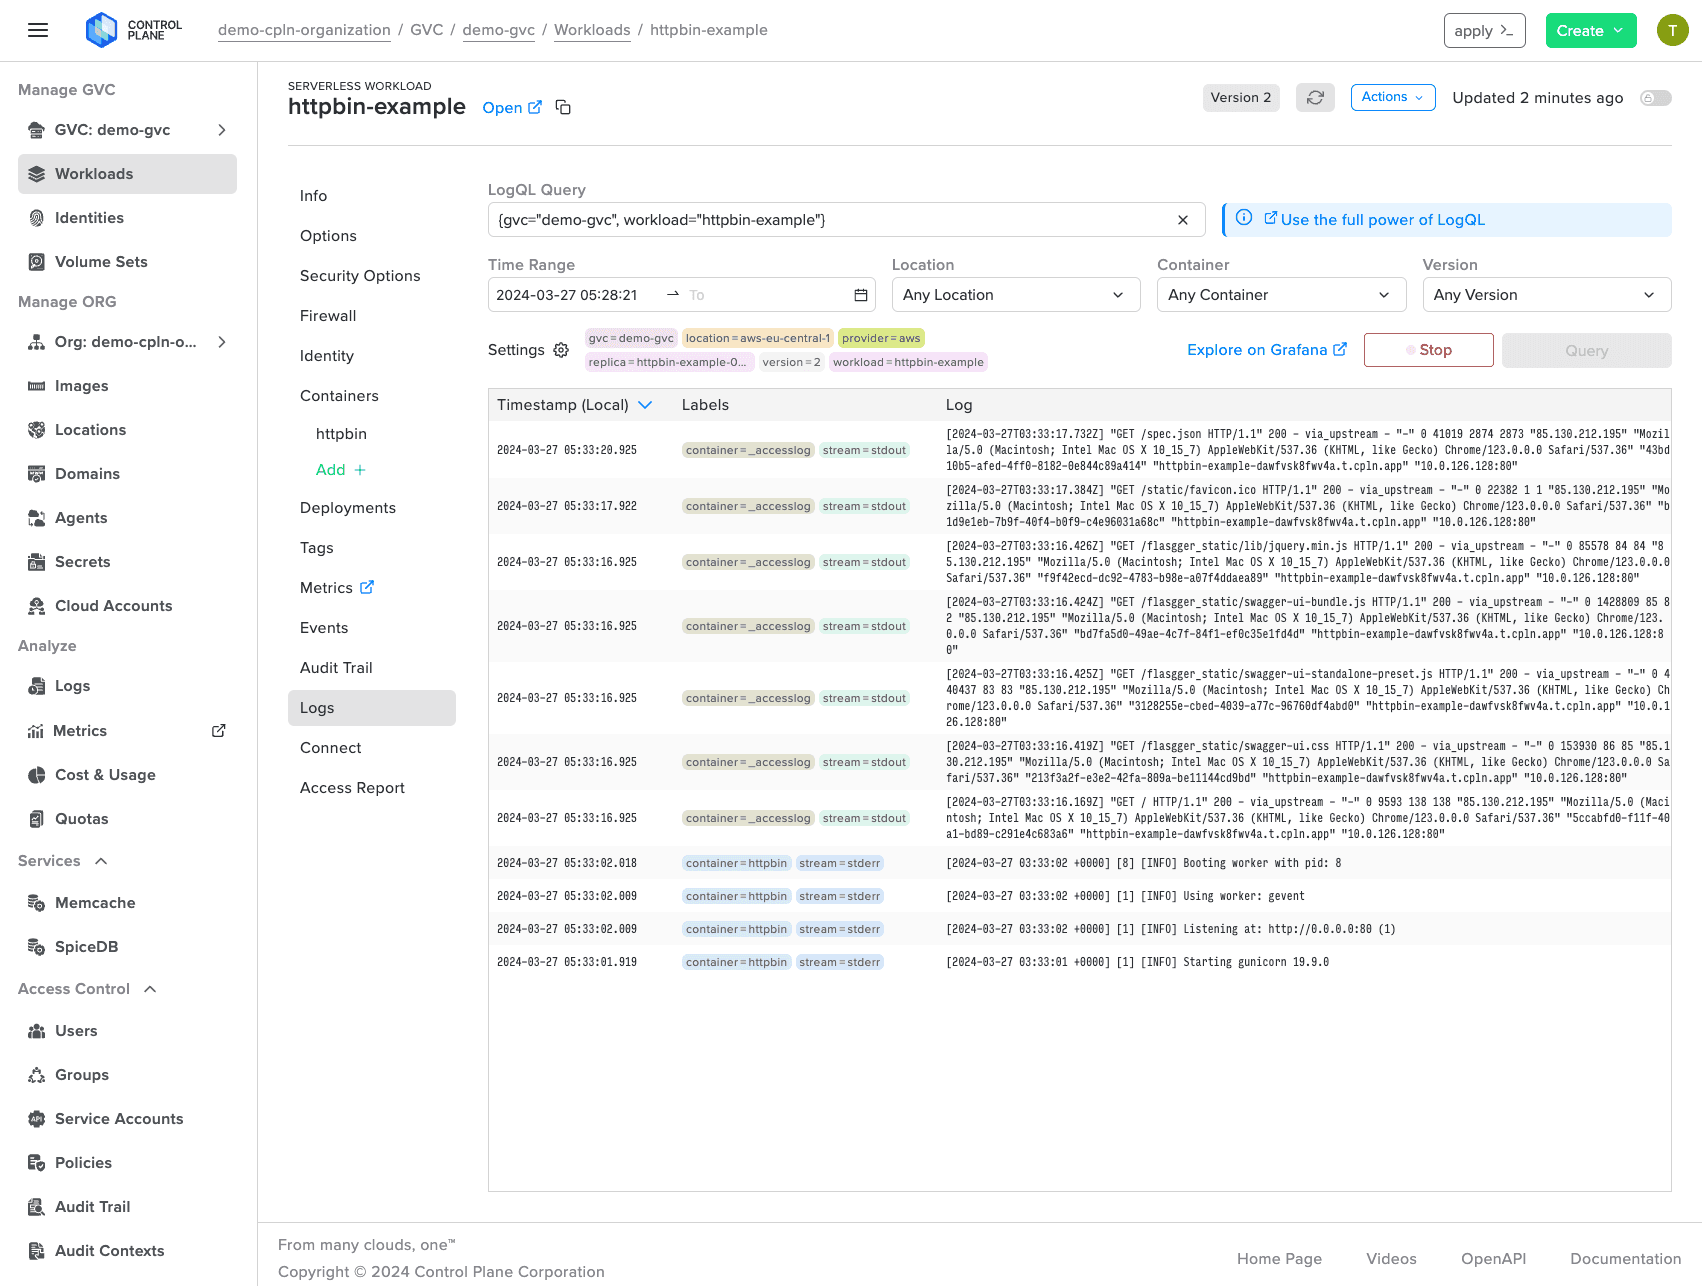
Real-time logging and flexible querying
Identify issues quickly with real-time log ingestion and powerful querying using LogQL. Filter logs by location, container, start/end dates, and more to pinpoint workload-specific problems effortlessly.
Integrated Grafana explorer
Visualize and analyze log data through the built-in Grafana explorer. Filter by GVC™, workload, time range, and more — gaining deeper insights into your cloud infrastructure for quick identification and resolution of issues.
External log-provider integration
Seamlessly ship logs to external providers like Coralogix, Datadog, Amazon S3, and Logz.io, leveraging their storage and visualization capabilities for a consolidated view of your data.
Walkthrough of the centralized log experience.


Master metrics management with ease
Embrace data-driven decision-making with Control Plane's powerful metric collection. Gain a comprehensive view of your cloud operations to identify bottlenecks, optimize resource utilization, and deliver a superior experience to your customers.
Prometheus-formatted metric collection
Collect and centralize custom metrics from your workloads in the widely-adopted Prometheus format — no complex integrations required. Build unlimited custom dashboards in Grafana and set alerts via PagerDuty, SMS, email, Slack, and more.
Granular configuration
Configure metric collection at the container level, giving you fine-grained control over which metrics are collected and from where.
Flexibility and scalability
As your applications scale and evolve, Control Plane's metric collection grows with you — providing a future-proof solution for your monitoring needs.

Setting up Prometheus-based metric collection end-to-end.
Flexible distributed tracing
Gain precision, clarity, and control in understanding and optimizing your application's performance. Interact with your microservices end-to-end and never miss a trace.
Seamless OpenTelemetry integration
Direct integration with the OpenTelemetry Protocol (OTLP) ensures your tracing data is collected with unparalleled accuracy and efficiency. Choose your preferred tracing backend and let Control Plane handle the complexities.
Advanced visualization in Grafana
A comprehensive view of logs and traces across GVCs, locations, workloads, and container replicas — translated into clear, actionable insights through customizable dashboards.
Customizable Envoy/Istio configuration
Flexible configurations let you tailor your tracing strategy to your operational requirements, accommodating diverse preferences for tracing data collection and analysis.


Eliminate backend visibility challenges with Control Plane.
Sign up free. No cloud accounts required.
- SOC 2 Type II
- PCI DSS Level 1
- HIPAA
- GDPR