Kubernetes has changed the way teams deploy and scale applications, but many organizations overlook a critical aspect of running it well: resource utilization. Kubernetes excels at scheduling and scaling workloads. Making sure those workloads actually use the resources they reserve still falls on operations teams.
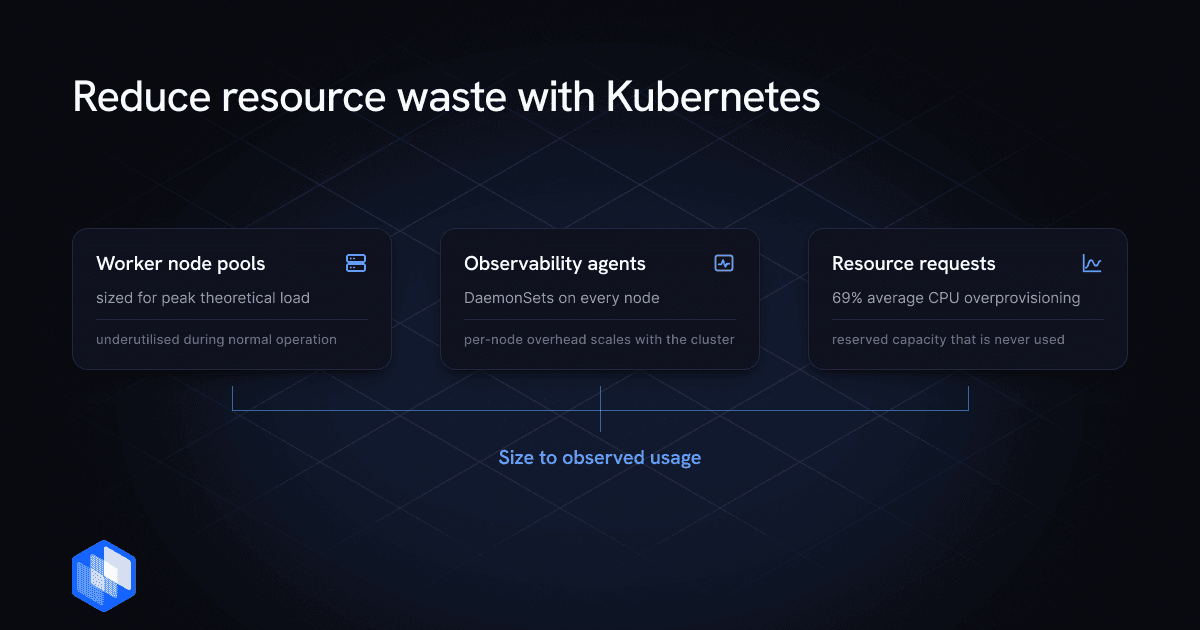
The numbers show how widespread the problem is. According to the CAST AI 2026 State of Kubernetes Optimization Report, average CPU utilization across production clusters stands at just 8%, down from 10% the year before. Memory utilization has dropped to 20%. CPU overprovisioning has risen sharply to 69%, and for teams running AI/ML workloads, GPU utilization averages a dismal 5% across analyzed clusters. Separately, Datadog’s State of Cloud Costs 2024 found that 83% of container spend is tied to idle resources, making an already expensive resource category dramatically more wasteful.
The cost consequence is direct. With CPU utilization at 8% and 83% of container spend tied to idle resources, the gap between what teams provision and what their workloads actually consume can translate directly into substantial cloud spend.
3 Key Challenges of Reducing Resource Waste with Kubernetes
Managing resource consumption within a dynamic Kubernetes environment presents several challenges that are harder to solve than most teams initially expect.
1. Lack of Meaningful Visibility
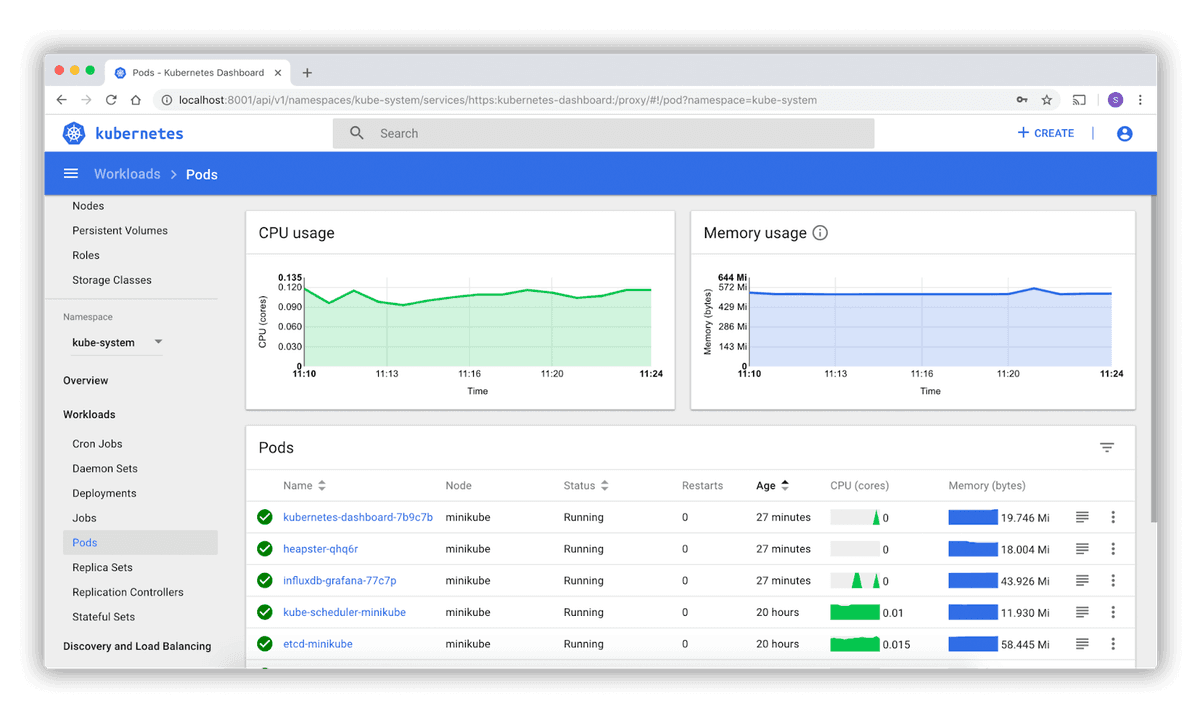
Understanding resource utilization goes beyond deploying dashboards and reading graphs. Gaining actionable insight into resource waste is harder than deploying a monitoring stack, and many organizations end up flying blind on actual usage. Tools like OpenCost and Kubecost help allocate spend at the pod, workload, and namespace level, but only if labeling standards are consistent enough to make the data meaningful. Without consistent labels, cost data is noise.
2. Multi-Component Complexity
Nodes are not the only place where resource waste occurs in Kubernetes workloads. Worker node pools sized for peak theoretical load sit underutilized during normal operations. DaemonSet-based observability agents (log collectors, monitoring exporters) run on every node regardless of whether that node needs them, adding per-node overhead that scales linearly with your cluster size.
The same logic extends to ingress controllers, monitoring systems, and GPU node pools. Each component needs to be right-sized for your specific needs, and failing to do so produces significant waste across the cluster. AI and ML workloads add another dimension, because GPU nodes are expensive and difficult to share, so misconfigured scheduling or idle model-serving deployments burn budget at an accelerated rate.
3. Poor Application Instrumentation
Without proper application instrumentation, resource allocation becomes a guessing game. If you do not know how much resource your application actually uses, you will over-provision to ensure performance, and that waste compounds across every workload in your cluster. Accurate application-level metrics are what make appropriate resource requests and limits possible.
Why Reducing Kubernetes Resource Waste Costs Your Team Real Money
The challenges above are not just operational inconveniences. They translate directly into financial, environmental, and performance consequences that compound over time.
Cost Optimization
Resource waste in Kubernetes environments translates directly to unnecessary cloud spending. With CAST AI reporting 8% average CPU utilization and Datadog finding 83% of container spend tied to idle resources, the scale of the problem is clear. Running workloads on the resources they actually need is the most direct path to cutting your cloud bill.
Environmental Impact
Data center energy consumption is rising sharply, driven in part by the rapid expansion of AI infrastructure. Running fewer underutilized nodes reduces your organization’s carbon footprint and contributes to broader sustainability goals.
Performance and Scalability
Efficient resource utilization lets you run more workloads on the same infrastructure, improving overall cluster utilization and giving you room to scale more cost-effectively as demand grows.
6 Ways to Reduce Resource Waste with Kubernetes
The following strategies address resource waste at different layers of the Kubernetes stack, from node-level cost optimization to application-level profiling.
1. Use Spot Instances
Discounted spare-capacity offerings (Spot Instances on AWS, Spot VMs on GCP and Azure) are available at a fraction of regular compute pricing, with the trade-off that the provider can reclaim them with short notice.
Building resilient workloads on spot instances requires multiple layers. Replicate your pods across nodes using topology spread constraints or pod anti-affinity so that a single reclamation does not take down the entire workload. Implement graceful termination handling that responds to provider interruption and preemption notices to drain connections and checkpoint state where appropriate. For stateful or long-running batch workloads, consider checkpointing progress so that a replacement pod can resume rather than restart from zero. Tools like Spot by NetApp or AWS Spot Fleet can help manage fleet composition and fallback to on-demand instances.
Pod Disruption Budgets (PDBs) complement this by protecting your workloads during voluntary evictions such as planned node drains, cluster upgrades, or maintenance windows. A PDB limits how many pods of a replicated application can be taken down simultaneously during these voluntary operations. Note that spot instance reclamation is an involuntary disruption, so PDBs do not directly govern that behavior, but they remain valuable for the planned eviction workflows that are part of normal cluster operations. Google recommends Spot VMs specifically for fault-tolerant workloads that can handle interruption.
2. Profile Your Applications
Before adding a node to your cluster, understand where the bottleneck actually is. Profiling can reveal whether you are facing a resource constraint or an application-level issue. Open-source tools like pprof for Go applications or cProfile for Python give you visibility into application performance, and distributed tracing tools like Jaeger or OpenTelemetry extend that visibility across service boundaries. Combining both gives you a complete picture of resource utilization so you can scale or optimize from evidence rather than intuition.
3. Implement HPA, VPA, and KEDA
Horizontal Pod Autoscaler (HPA), Vertical Pod Autoscaler (VPA), and KEDA (Kubernetes Event-driven Autoscaling) each solve a different part of the dynamic resource problem.
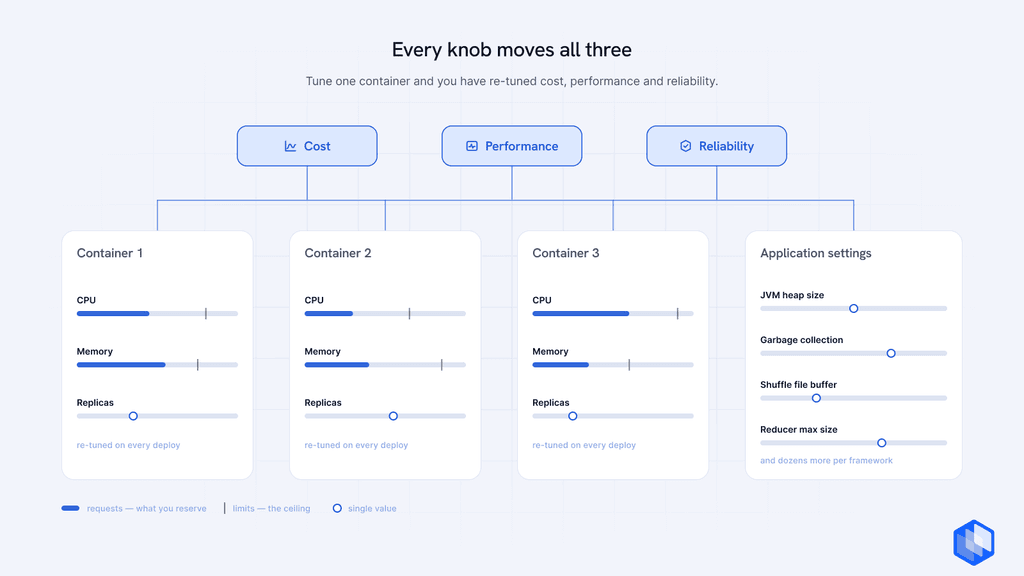
Use HPA when your application benefits from running multiple instances. Use VPA when your resource needs fluctuate but horizontal scaling is not an option, since VPA automatically adjusts CPU and memory requests based on observed usage, which is the most direct path to right-sized workloads. KEDA extends this by scaling pods based on external signals like queue depth, stream lag, or custom metrics, making it especially useful for event-driven and batch workloads.
For node-level scaling, the right tool depends on your provider. On AWS EKS, Karpenter dynamically provisions nodes based on the requirements of pending pods. On AKS, Node Auto Provisioning provides Karpenter-based node scaling. GKE provides its own native node auto-provisioning and ComputeClasses capabilities. Regardless of provider, the principle is the same: combine workload-level autoscaling (HPA or KEDA) with node-level provisioning so that inflated requests do not unnecessarily inflate your node pool.
4. Monitor Wisely
Over-instrumentation creates noise that distracts from cloud cost optimization goals. Use tools like Prometheus and Grafana, but focus on KPIs directly tied to resource usage and application performance. Regularly review and prune unnecessary metrics to keep your monitoring system lean and focused.
5. Fix the Application Before You Scale the Infrastructure
Autoscaling and adding nodes are not always the answer. Sometimes the bottleneck is in your application, and provisioning around it defers the problem rather than fixing it.
Before scaling, look for opportunities to optimize code or database queries. Architectural changes like implementing caching or reducing chattiness between services often produce more sustainable savings than adding capacity, because the root cause stays fixed. Section 2 above covers how to identify these opportunities through profiling and tracing. This section is the decision rule: if profiling reveals an application or database inefficiency, fix the inefficiency before provisioning around it.
6. Use Control Plane
Control Plane is a cloud virtualization platform that composes AWS, GCP, Azure, and private infrastructure into a single virtual cloud layer, giving engineering teams a unified platform that runs workloads across any provider at the right scale without locking them into a single one. Rather than adding another layer of Kubernetes optimization tooling, Control Plane lets teams stop managing infrastructure sprawl and start running production workloads on a platform built for it.
Control Plane’s Capacity AI feature automatically right-sizes container CPU and memory allocations based on historical usage, so you are not reserving more resources than your workloads actually consume. One EdTech customer reduced overnight pods from ten to three, scaling on demand and lowering cloud compute costs by 30 to 40% with no user-visible degradation.
Frequently Asked Questions
Low CPU utilization in Kubernetes clusters is primarily caused by over-provisioned resource requests. When engineers set CPU requests higher than applications actually consume, the kube-scheduler reserves that capacity on nodes even though it is never used. According to the CAST AI 2026 State of Kubernetes Optimization Report, average CPU utilization across production clusters sits at just 8%, with CPU overprovisioning at 69%.
Resource requests tell the kube-scheduler how much CPU or memory to reserve on a node for a pod, while resource limits cap how much a container can actually consume at runtime. Setting requests too high wastes reserved capacity across the cluster. Setting limits too low causes throttling or out-of-memory kills. Right-sizing both values to observed usage data is the most direct way to reduce waste.
The Vertical Pod Autoscaler (VPA) monitors actual CPU and memory consumption for each container and automatically adjusts resource requests to match observed usage. This removes the manual guesswork from right-sizing and prevents the compounding waste that occurs when engineers set conservative requests across dozens of workloads. VPA is most effective for workloads where horizontal scaling is not practical.
KEDA is useful when your scaling signal comes from an external or event-based source rather than CPU or memory metrics. Queue depth, Kafka consumer lag, database row counts, and custom application metrics are all signals KEDA can act on through its ScaledObject resources. KEDA also enables scale-to-zero, which HPA alone does not support. KEDA integrates with the Kubernetes HPA rather than replacing it: KEDA handles activation and deactivation (scaling between zero and one replica) and feeds scaling metrics to the HPA, which then manages replica counts from one upward. This makes KEDA a complement to HPA for event-driven and batch workloads, not a mutually exclusive alternative.
A Pod Disruption Budget (PDB) defines the minimum number of pods that must remain available during voluntary disruptions such as planned node drains, cluster upgrades, or maintenance windows. PDBs do not govern involuntary disruptions like spot instance reclamation. For spot workloads, resilience comes from replication, topology spread constraints, graceful termination handling, and responding to provider interruption notices. PDBs remain valuable for the voluntary eviction workflows that are part of normal cluster operations.
Accurate measurement requires cost allocation tooling with consistent namespace and workload labeling. Tools like OpenCost and Kubecost break down spend at the pod, workload, and namespace level, making it possible to identify which workloads are consuming budget without delivering proportional value. Without consistent labeling standards, the data these tools produce is too coarse to act on.
GPU nodes are expensive and difficult to share across workloads, so idle model-serving deployments and misconfigured scheduling leave them underutilized for long periods. The CAST AI 2026 report puts average GPU utilization at 5% across analyzed clusters. Pooling GPU capacity across providers and using smarter placement logic, rather than dedicating nodes to single workloads, is the most direct way to close that delta.
Closing the Provisioning Delta with Control Plane
Average CPU utilization fell year over year, which tells you that efficiency does not improve automatically as Kubernetes environments mature. Right-sizing workloads, running spot instances, implementing multi-layered autoscalers, and keeping monitoring lean are all continuous disciplines, and each one requires accurate data to work.
Control Plane pulls that work together into a unified cloud virtualization platform, right-sizing workloads with Capacity AI and eliminating idle or over-provisioned resources, leaving you with infrastructure that scales with your workloads.
Get started with Control Plane and pay only for what you use.