
To make an AI-generated app survive a traffic spike, audit the generated code for single-instance assumptions like in-memory state, local files, a database connection per request, and synchronous AI calls with no timeout, then fix those patterns before launch. Run the app on infrastructure that autoscales stateless replicas across more than one location, put caching, rate limits, and queues in front of expensive calls, and load test at several times your expected peak before anyone sees a link.
Disclosure: Control Plane publishes this guide.
TL;DR
Many spike failures in AI-generated apps come from a short list of code patterns, so the work splits into fixing the code first and configuring the infrastructure second.
- Audit generated code for patterns that work for one user but fail under load.
- Make the app stateless so any replica can serve any request.
- Protect the database with connection pooling, indexed queries, and pagination.
- Protect AI and third-party API calls with timeouts, retries with backoff, circuit breakers, rate limits, and queues.
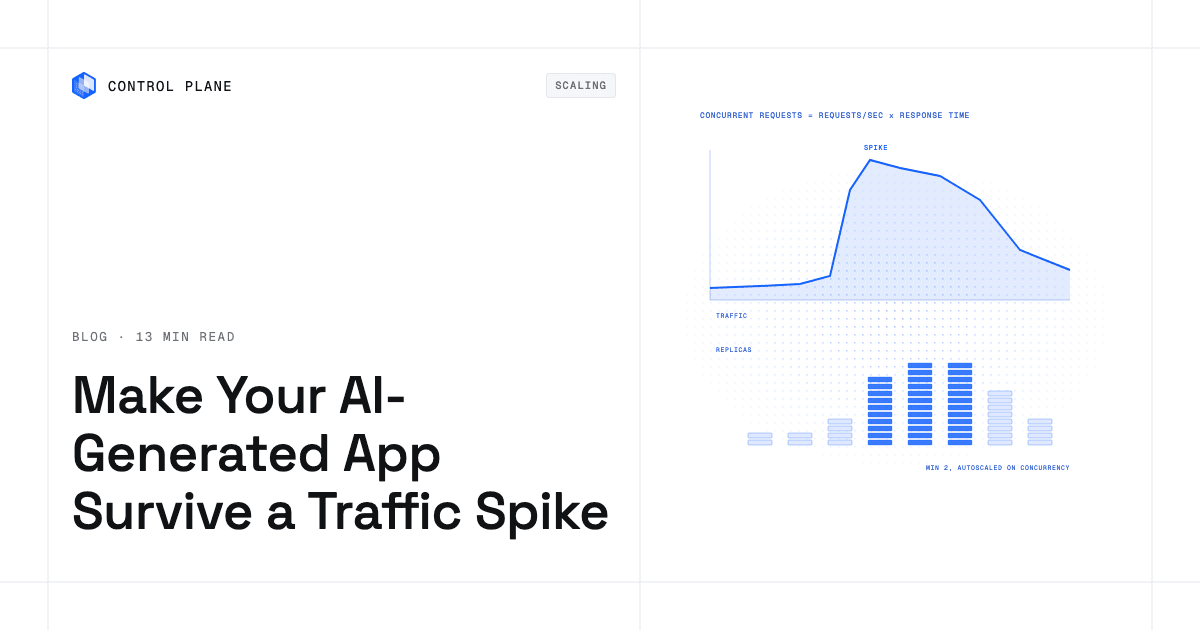
- Autoscale on the right metric such as concurrent requests or requests per second, with a minimum of two replicas.
- Load test at several times expected peak with LLM calls stubbed to avoid cost and rate-limit bans.
- Watch the right metrics during the spike including p95 latency, error rate, database connections, and replica count.
- Control Plane autoscales replicas on requests per second, concurrent requests, latency, CPU, or memory, runs one workload definition in every location of a Control Plane Global Virtual Cloud (GVC), and includes metrics and dashboards by default.
How do I make sure my AI-generated app can handle a traffic spike?
For a small app, this plan is usually days of work.
- Audit the generated code using the spike-readiness table in this guide. Search for in-memory sessions, local file writes, missing connection pools, N+1 queries, synchronous LLM calls, missing timeouts, and exposed API keys.
- Fix state by moving sessions to a shared store like Redis and uploads to object storage such as S3 or GCS.
- Pool database connections using PgBouncer for PostgreSQL or an equivalent pooler. Size each replica’s pool from the database limit down: take the database’s max_connections (PostgreSQL’s default is typically 100), reserve some for admin work and migrations, and divide the rest by the maximum replica count across all locations. If that leaves only a few connections per replica, put PgBouncer in transaction mode in front of the database so many app connections share a small server pool. Transaction mode does not support session-level features such as SET, LISTEN, and session advisory locks, and some ORMs need a setting for it.
- Cache repeated reads at the application layer or CDN. Cache AI responses only for prompts that contain no user-specific data, keyed by a hash of the full prompt, model, and parameters, and only where reusing an earlier answer is acceptable.
- Queue slow work by moving LLM calls, email sends, image generation, and file processing into a background job queue. Return a job ID to the client and let it poll or subscribe for the result. Poll every few seconds at most, or push the result over WebSockets or server-sent events, so polling does not become its own spike.
- Rate limit per user and per IP on all public endpoints, especially any endpoint that triggers an AI API call.
- Set timeouts and retries with exponential backoff on every outbound HTTP call. Cap retries at two or three, add random jitter, honor Retry-After on 429 responses, and retry only idempotent operations. Make queued jobs idempotent with a job key, because most queues deliver a job at least once and a retried job must not charge, email, or call the AI provider twice. Add a circuit breaker so a failing downstream service does not consume all your threads.
- Configure autoscaling and minimum replicas. Choose a scaling metric that reflects real demand, like concurrent requests or requests per second. For production, keep at least two replicas running and spread them across more than one location. Before a planned spike such as a launch or press mention, raise the minimum replica count ahead of time, because new replicas take time to start.
- Load test at three to five times your expected peak. Stub or mock the LLM provider. Record p95 latency, error rate, database connection usage, and replica count.
- Set alerts on error rate, p95 latency against your service level objective (SLO), database connection saturation, and replica count reaching its maximum. Starting points such as 1% errors and 80% of connections in use are suggestions to tune.
- Plan graceful degradation. When the AI provider is slow or down, serve a cached response, a simplified non-AI fallback, or a clear retryable error. Prioritize core user flows over AI-enhanced features.
Why do AI-generated apps break under load?
AI coding tools tend to produce code that runs on the first try for one user in one process. The demo often stores sessions in a local variable, writes files to the container’s filesystem, opens a fresh database connection on every request, and calls an LLM synchronously in the request path with no timeout. These patterns usually pass manual testing.
Under load, each pattern becomes a single point of failure. In-memory sessions mean a second replica has no idea who the user is. A new database connection per request exhausts the connection limit within seconds at scale. A synchronous LLM call that takes eight seconds holds a worker, or a request slot in an async server, for eight seconds, and when hundreds of those pile up, the app stops responding to everyone, including users who never touched the AI feature.
A focused audit and targeted changes usually fix it without a rewrite.
Spike-readiness audit for AI-generated code
| Failure point | Pattern to look for in generated code | What happens during a spike | Fix |
|---|---|---|---|
| In-memory sessions or state | Session data stored in a local object or global variable | Second replica has no session; users get logged out or see errors | Move sessions to Redis or another shared store |
| Files written to local disk | Uploads saved to the container filesystem; SQLite as the production database | Files vanish when a replica restarts or scales; SQLite allows one writer at a time and its file cannot be shared across replicas | Use object storage for files; use PostgreSQL or another client-server database |
| New database connection per request with no pool | A client or connect call inside every request handler | Connection limit exhausted in seconds; new requests fail with errors such as PostgreSQL’s “sorry, too many clients already” | Use a connection pool with a bounded maximum; add PgBouncer for PostgreSQL |
| N+1 queries and unbounded queries | A loop that runs one query per item; a select with no limit | Database CPU spikes; response times climb; other queries queue behind | Use eager loading or batch queries; add pagination and indexes |
| No caching of repeated reads or repeated AI prompts | Every request hits the database or AI API even for identical inputs | Unnecessary load on the database and AI provider; higher cost and latency | Cache at the application layer or CDN; cache AI responses by a hash of prompt, model, and parameters, only for prompts with no user data |
| Synchronous LLM or third-party API calls in the request path | An awaited LLM API call inside the HTTP handler with no queue | Each call holds a worker or request slot for seconds; throughput collapses | Move AI calls to a background queue; return a job ID; poll or use WebSockets for the result |
| No timeouts, retries with backoff, or circuit breaking | HTTP calls to external services with no timeout set | A slow upstream service ties up all workers indefinitely | Set timeouts on every outbound call; add exponential backoff retries; add a circuit breaker |
| No rate limiting per user or IP | All endpoints open with no throttle | A single user or bot can exhaust your AI budget and starve other users | Add rate limiting per user, per IP, and per endpoint, with counters in Redis or at the edge; in-memory counters reset per replica and multiply the limit by the replica count |
| API keys exposed to the browser | AI provider keys in client-side JavaScript or environment variables bundled into the frontend | Anyone can extract the key and make unlimited calls at your expense | Proxy AI calls through your backend; never ship secret keys to the client |
| Background jobs run inside the web process | Cron-like tasks or queue consumers running in the same process as the HTTP server | Jobs compete with web requests for CPU and memory; a long job blocks responses | Run background jobs in a separate worker process or a dedicated cron workload |
| No graceful shutdown | No SIGTERM handler; the process exits immediately | Scale-down and deploys during the spike drop in-flight requests and half-finished jobs | On SIGTERM, stop accepting new requests, finish in-flight ones within the grace period, close database pools, and return unfinished jobs to the queue |
| No health check endpoint | No health or readiness route | Orchestrator cannot tell if a replica is healthy; broken replicas keep receiving traffic | Add a readiness endpoint that returns 200 once the app can accept requests and a liveness endpoint that checks only the process; keep database checks out of both so a database blip does not mark every replica unhealthy at once |
| Single replica in one region | Deployment defaults to one instance in one data center | Any failure in that instance or region means total downtime | Run two or more replicas across more than one location |
| Large static assets served by the app server | Images, fonts, and JavaScript bundles served by the Node or Python process | App server CPU and bandwidth consumed by static files instead of API requests | Serve static assets from a CDN or object storage |
How much capacity do I need for a spike?
Use Little’s Law to estimate the average number of concurrent requests your infrastructure must handle at a given request rate. The formula: concurrent requests = requests per second × average response time in seconds.
All numbers in this example are hypothetical.
| Parameter | Value |
|---|---|
| Expected peak requests per second | 200 |
| Average response time for standard requests (80% of traffic) | 0.25 seconds |
| Average response time for AI-enhanced requests (20% of traffic) | 8 seconds |
| Concurrent standard requests | 160 rps × 0.25 s = 40 |
| Concurrent AI requests | 40 rps × 8 s = 320 |
| Total concurrent requests | 360 |
The same hypothetical numbers translate into infrastructure requirements.
| Resource | Calculation | Hypothetical result |
|---|---|---|
| Replicas needed (if each handles 30 concurrent requests) | 360 / 30 | 12 replicas |
| Database connections (if each replica holds 10 connections) | Replicas × 10 | 120 at 12 replicas and 180 to 240 at an autoscaling maximum of 18 to 24, all above PostgreSQL’s default of 100, so add PgBouncer in transaction mode or raise the limit |
| AI provider rate limit needed | 40 requests per second (2,400 per minute), plus tokens per minute at your average prompt and response size | Confirm your plan supports this; request a limit increase before launch |
The AI-enhanced requests dominate the concurrency even though they are only 20% of traffic. Moving AI calls to a background queue removes the 8-second wait from web replicas. Queue workers then run AI calls at a concurrency you set below the provider’s rate limit, and extra demand waits in the queue instead of failing. For chat interfaces, streaming the response over server-sent events is the usual alternative to polling, though each open stream still counts toward web replica concurrency.
Set the autoscaling maximum at 1.5 to 2 times the calculated replica count, and load test at three to five times expected peak to find where the app breaks. Check that the database pool math from step 3 still holds at that maximum.
How do I load test an AI-generated app before launch?
Grafana k6 scripts user flows in JavaScript. Locust is a Python alternative with a built-in web UI for watching results in real time.
- Script critical user flows. Include signup, login, search, the main feature, and any endpoint that triggers an AI call. Run against a staging database seeded with production-sized data, because N+1 and unindexed queries stay fast on small tables.
- Stub or mock the LLM provider. Replace the real AI API with a mock that returns a realistic response after a realistic delay (for example, 2 to 8 seconds). This avoids burning your API budget and hitting rate limits during the test. Stub email, payment, and other third-party APIs the same way, and run a separate low-volume test against the real AI provider to confirm your requests-per-minute and tokens-per-minute limits.
- Ramp to three to five times expected peak. Start at baseline traffic and ramp up over several minutes. Hold at peak for at least 10 minutes to surface memory leaks and connection exhaustion.
- Watch these metrics during the test: p95 and p99 latency, HTTP error rate (5xx responses), database active connections versus maximum, replica count and autoscaling events, and queue depth if you use background workers.
- Run a spike test. Jump from baseline to peak in under 30 seconds, hold for 5 minutes, then drop back. This shows whether autoscaling reacts in time.
- Run a soak test. Hold moderate load for several hours. Watch for memory growth, connection leaks, and disk usage.
- Test failover. Stop a replica or simulate a location failure during load, and confirm the remaining replicas keep serving. A staged approach lets you test failover without taking production down.
Fix each issue, then rerun the test.
What should I watch during a traffic spike?
The thresholds in this table are starting points to tune to your own SLOs and baseline.
| Metric | Healthy sign | Warning sign | Action |
|---|---|---|---|
| p95 response latency | Under your SLO | Rising above SLO or doubling from baseline | Check for slow queries, upstream timeouts, or insufficient replicas |
| HTTP error rate (5xx) | Under 0.1% | Above 1% | Check application logs, database connectivity, and downstream services |
| Database active connections | Under 70% of maximum | Above 80% of maximum | Verify connection pooling; reduce per-replica pool size or add read replicas |
| Replica count | Scaling up smoothly with demand | Hitting the configured maximum | Raise the autoscaling maximum or optimize per-request resource usage |
| AI provider latency | Stable at expected range | Spiking or returning 429 (rate limited) | Activate circuit breaker; serve cached or fallback responses |
| Queue depth (background jobs) | Processing keeps pace with ingestion | Growing faster than workers can drain | Add more workers or reduce job complexity |
| Memory per replica | Stable | Climbing steadily over time | Investigate memory leaks; restart replicas as a short-term measure |
| Cache hit rate | Above 80% for cacheable content | Dropping significantly | Check cache eviction policies and TTLs |
Where does Control Plane fit?
Control Plane is the unbreakable platform for running production workloads. It runs serverless, standard, stateful, and cron workloads natively on AWS, GCP, Azure, and Oracle Cloud Infrastructure (OCI), VM workloads on locations joined through Control Plane’s Managed Kubernetes, and workloads on Kubernetes clusters you already run or your own machines, including on premises, active-active across regions and clouds. Control Plane is PCI DSS Level 1, SOC 2 Type II, HIPAA, and GDPR compliant.
Control Plane handles Day 2 operations for you, including autoscaling, built-in observability, and security.
Autoscaling on the right metric. Control Plane autoscaling scales replicas between a minimum and maximum per location on a chosen metric: requests per second, CPU, memory, concurrent requests (serverless workloads), or request latency and multi-metric combinations (standard and stateful workloads). A GVC, Control Plane’s Global Virtual Cloud, is a named set of locations across one or more clouds. A workload deployed to a GVC runs in every location of that GVC from one definition, and the maximum scale applies per location. Standard and stateful workloads can also scale on event sources such as queue length through KEDA, enabled per GVC, so queue workers can scale on queue depth. For production, set a minimum of two replicas per location. The 99.999% availability SLA applies to workloads running at least two replicas in at least two locations.
Resource right-sizing. Capacity AI, Control Plane’s right-sizing feature, adjusts a workload’s reserved CPU and memory between set minimums and maximums based on historical usage. It is not available with CPU-utilization or multi-metric autoscaling, or with GPUs. You pay for the CPU and memory a workload reserves, so right-sizing lowers cost, and the minimums you set keep a floor of headroom for sudden spikes.
Safe deploys during a spike. During an update, each location keeps serving the previous version while the new one starts, and a new version that fails its readiness probe pauses the rollout before it takes over. Give each workload an HTTP readiness probe, because with no probe or a bare TCP check, new replicas receive requests before they are ready. By default a rollout can take one replica per location out of service while new ones start, so raise the minimum replica count before deploying at peak.
Built-in observability. Default metrics include request rate, a request latency histogram, CPU, memory, replica count, and restarts, with built-in Grafana dashboards. They cover the latency, replica count, and memory rows of the monitoring table; workloads can expose custom metrics for error rate, database connections, queue depth, cache hit rate, and AI provider latency.
Database and cache from the Template Catalog. Control Plane’s Template Catalog includes PostgreSQL (with optional PgBouncer connection pooling) and Redis for caching, so the database and cache deploy next to the app. Control Plane also documents per-workload rate limiting through an external Envoy rate limit service with a Redis backend.
AI coding tool integration. Control Plane’s MCP server lets an AI coding assistant deploy and inspect workloads, acting with the signed-in user’s permissions, and instructs the assistant to explain the impact and get your approval before destructive actions. The assistant that wrote the app can also deploy it and read its logs and metrics.
Serverless scale-to-zero. Serverless workloads can scale to zero when idle, and standard and stateful workloads can do the same through KEDA. That suits internal tools, previews, and background services; keep a minimum of two for public production endpoints.
Replica quotas. By default, quota caps a workload’s maximum scale at 5 replicas per location. Spread over two or three locations, the example’s 18 to 24 autoscaling maximum still means 6 to 12 replicas per location, so it needs a quota increase. Before launch, confirm the quota covers your per-location maximum.
What autoscaling does not fix. Autoscaling does not fix code that keeps state in memory or opens a database connection per request, and it does not raise a third-party AI provider’s rate limits. The code audit comes first. The infrastructure comes second.
Small teams without a platform team can run production-grade infrastructure without one and give developers self-service with guardrails. For choosing where to run, the best hyperscaler alternatives in 2026 compares the options.
FAQ
Common questions about preparing AI-generated apps for production traffic.
How do I make sure my AI-generated app can handle a traffic spike?
Fix the code before scaling the infrastructure. Remove in-memory state, local file storage, unpooled database connections, and synchronous AI calls; then autoscale stateless replicas across at least two locations and load test at three to five times expected peak.
Can a vibe-coded app run in production?
Yes, after the code is fixed for multiple replicas. AI-generated code commonly assumes a single process serving one user. Most fixes are targeted changes to connection handling, state management, and async processing, so a full rewrite is rarely needed.
What is the most common reason AI-generated apps crash under load?
Database connection exhaustion is one of the most common causes. AI coding tools often generate code that opens a new database connection on every request without using a connection pool. At moderate concurrency, the database hits its maximum connection limit and every subsequent request fails. A connection pool with a bounded maximum is usually the highest-impact fix.
Should I use serverless for a traffic spike?
Serverless fits internal tools, previews, and other apps with unpredictable traffic where scaling to zero between spikes saves cost; keep a minimum of two replicas for public production endpoints. The trade-off is that the first requests after scaling from zero wait for a replica to start, and the code must still be stateless and use pooled database connections. On Control Plane, choose a standard workload instead when the app needs latency-based or multi-metric autoscaling, KEDA triggers, or more than one port.
How do I stop an AI feature from burning my API budget during a spike?
Move AI API calls to a background queue with a concurrency limit to cap calls per second. Cache responses for identical prompts that contain no user-specific data; near-identical prompts need semantic (embedding-based) caching. Add per-user and per-IP rate limits on any endpoint that triggers an AI call. Set a spend limit with your AI provider where it offers one, plus a budget alert. Add a circuit breaker that stops requests when the provider returns errors or rate-limit responses.
How many replicas should I run?
Use the Little’s Law calculation: concurrent requests equals requests per second multiplied by average response time. Divide the total concurrent requests by the number each replica can handle. Set the autoscaling maximum 1.5 to 2 times higher, and confirm it in a load test at three to five times expected peak. On Control Plane, a new workload defaults to one replica per location, so set the minimum to at least two per location for production; the 99.999% availability SLA applies to workloads running at least two replicas in at least two locations.
Do I need Kubernetes to autoscale?
No. Managed container services and platforms such as Control Plane autoscale without a cluster for you to operate. Control Plane runs workloads natively on AWS, GCP, Azure, and Oracle Cloud, and also supports your own Kubernetes clusters or machines. The app must be containerized, and the web tier should keep no state in memory or on local disk so any replica can serve any request.
How does Control Plane handle traffic spikes?
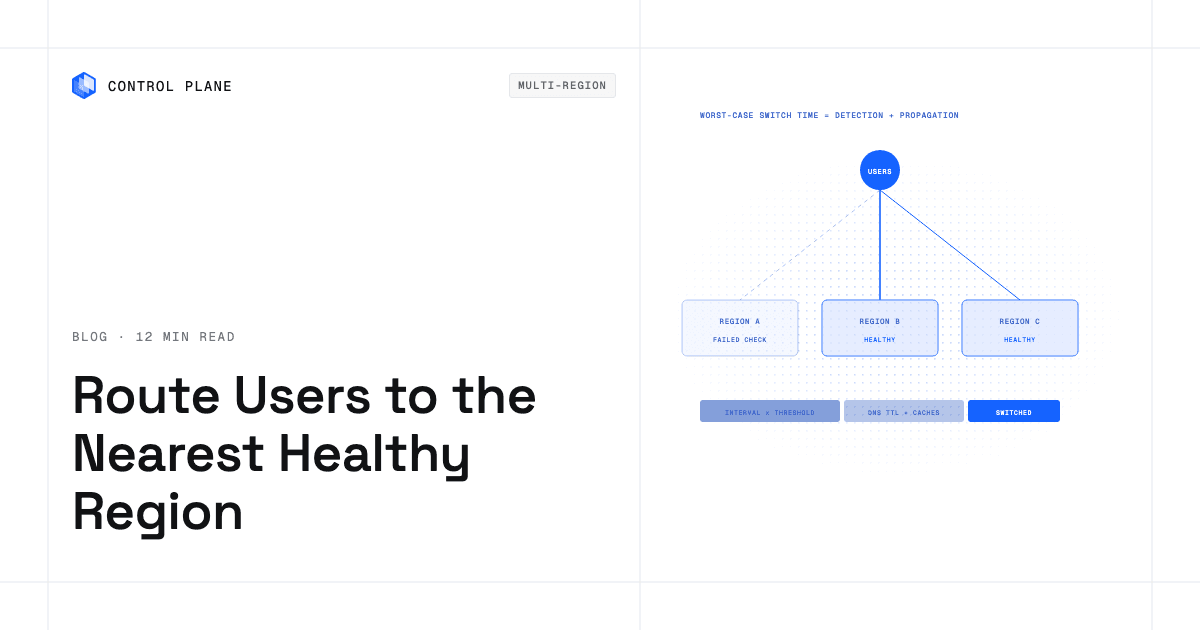
Control Plane autoscales replicas between a configured minimum and maximum per location based on requests per second, CPU, memory, concurrent requests, request latency, a combination of metrics, or KEDA event sources such as queue length, depending on the workload type. A workload deployed to a GVC runs in every location of that GVC from a single definition, and users are routed to the nearest healthy location. Built-in Grafana dashboards show request rate, latency, CPU, memory, and replica count. During a deploy, each location keeps serving the previous version while the new one starts, and a version that fails its readiness probe pauses the rollout instead of taking over traffic.
What tools should I use to load test an AI-generated app?
Grafana k6 and Locust are open-source load-testing tools. k6 uses JavaScript for test scripts and works well in CI pipelines. Locust uses Python and provides a real-time web dashboard. Whichever you choose, stub the LLM provider during tests to avoid cost and rate-limit issues, and ramp to several times your expected peak.
How often should I load test after launch?
Run a load test after every major code change, dependency upgrade, or infrastructure change. A small change can introduce a new N+1 query or remove a cache layer. Load tests in CI/CD catch these before production.
To run your AI-generated app on infrastructure that scales with a spike, talk to the Control Plane team or sign up free.